Sentinel-3C sees a hot Australian coast. Its first thermal map needs two scales
Near Broome, the colour key changes at the waterline. A second view of the same coast shows where fires left scars after the heat passed.
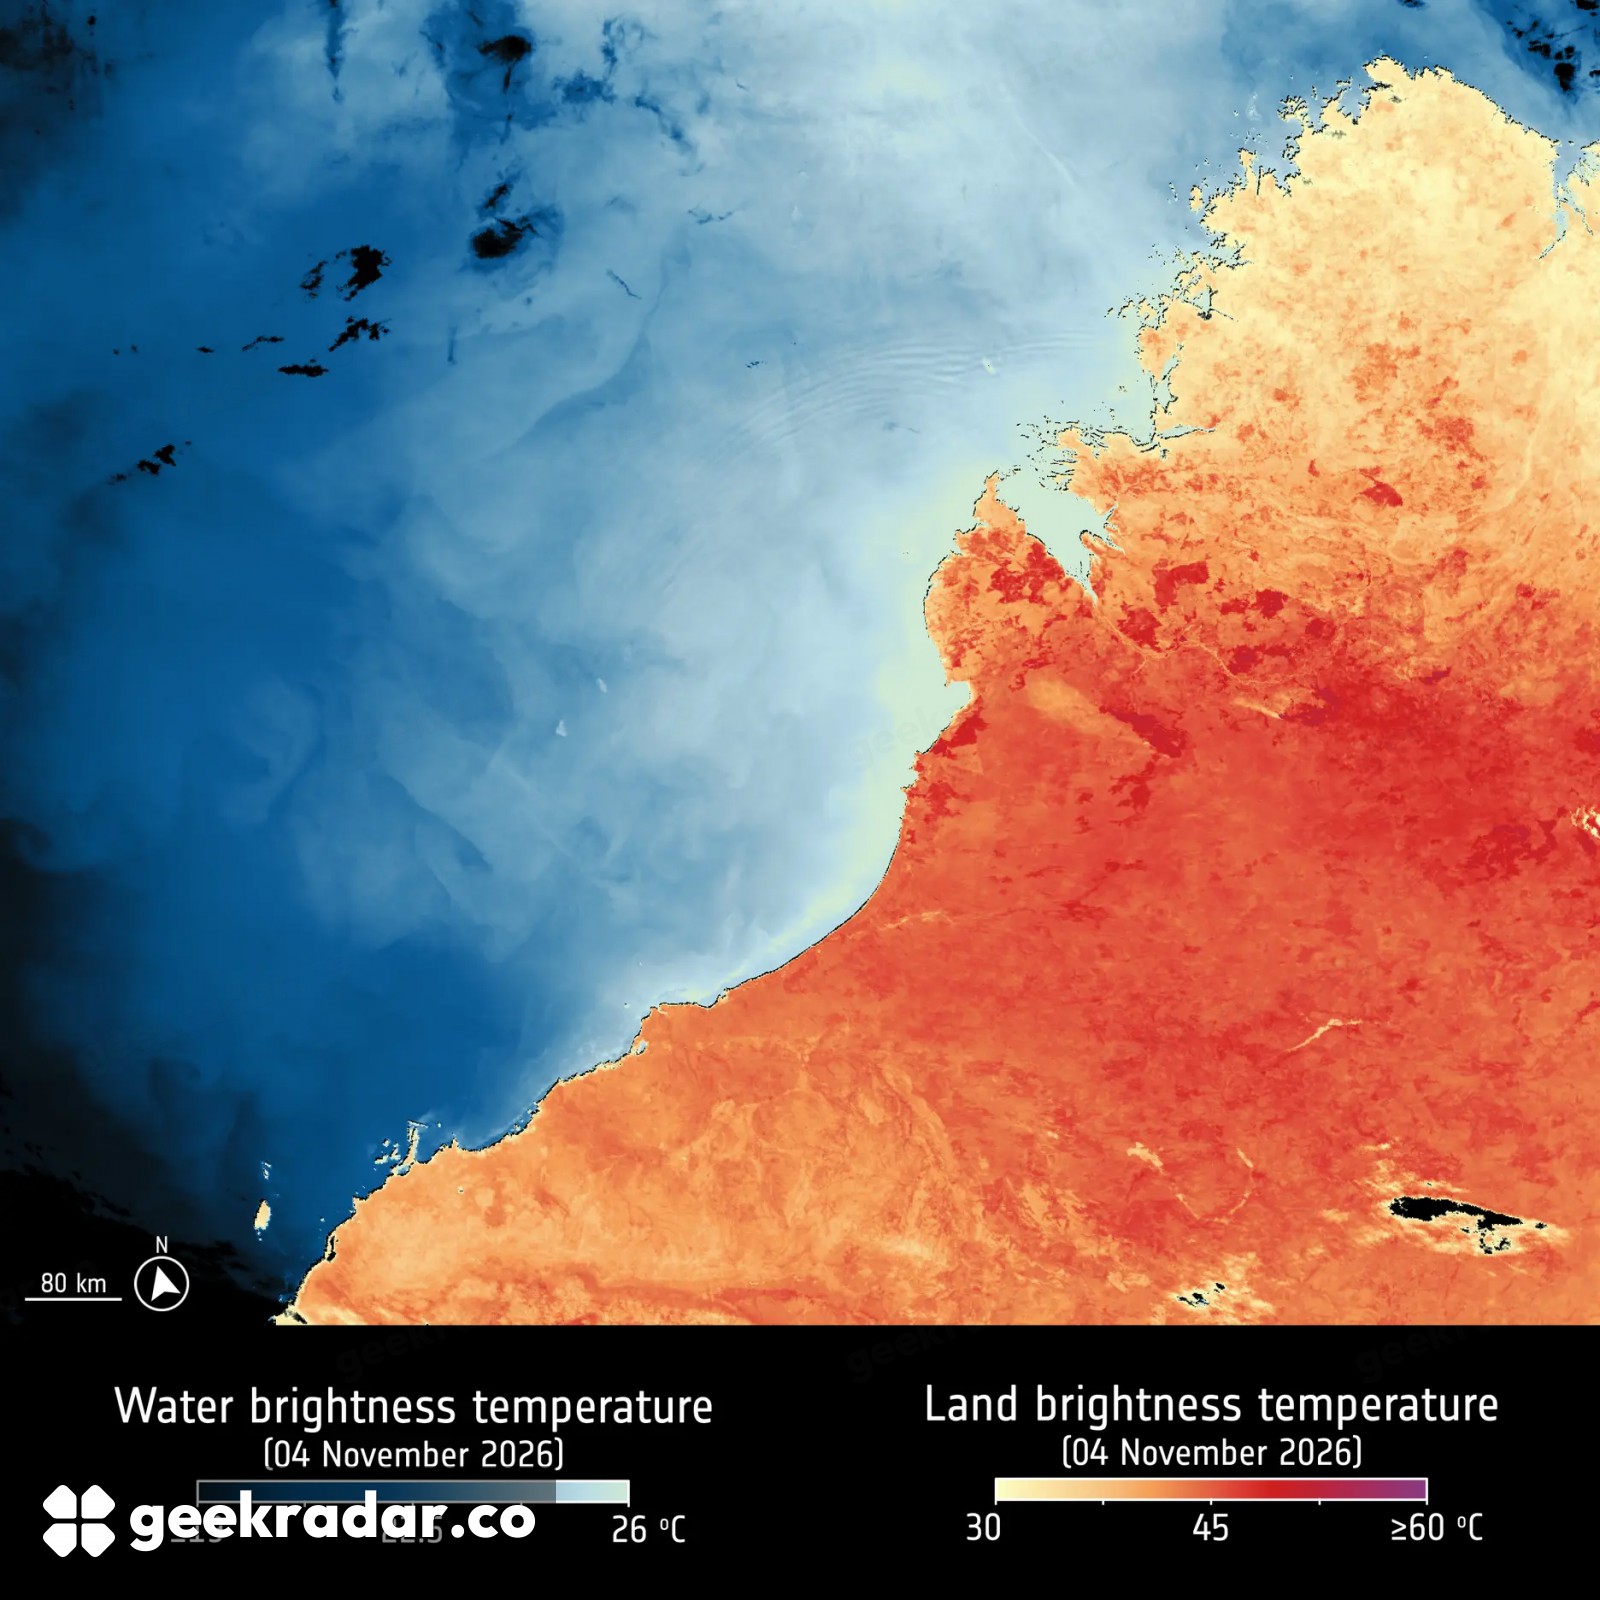
At the edge of Western Australia’s Dampier Peninsula, Sentinel-3C’s first thermal image changes colour abruptly. Follow the shore and something else changes there, too: the scale. The blue water and the orange land have separate temperature keys. Comparing their colours as if they belonged to one continuous scale gives the wrong reading precisely where the contrast looks most striking.
ESA released the images on November 18, while the new Copernicus satellite was still being checked out in orbit. Its Sea and Land Surface Temperature Radiometer, or SLSTR, had already returned a visible-light image. Its newly enabled infrared channels now reveal something that a photograph of the coastline cannot: how much thermal radiation reaches the instrument from the scene below.
How hot is that patch of red?
Find Broome near the middle of the November 4 observation, then follow the coast inland. Across much of the lower part of the frame, the land signal corresponds to more than 40 °C. Along stretches of the northern coast it is 35 °C or lower. Offshore, the eastern Indian Ocean comes in around 20 °C. The separate ocean scale lets you see variations within that cooler water that would be hard to pick out on a palette spanning the hottest land.
Those distinctions matter in a region that has experienced heatwaves and wildfires. A red patch in the thermal picture is evidence about the radiation recorded there on November 4. Identifying ground that actually burned takes a different reading of the same landscape.
The same coast in reflected light
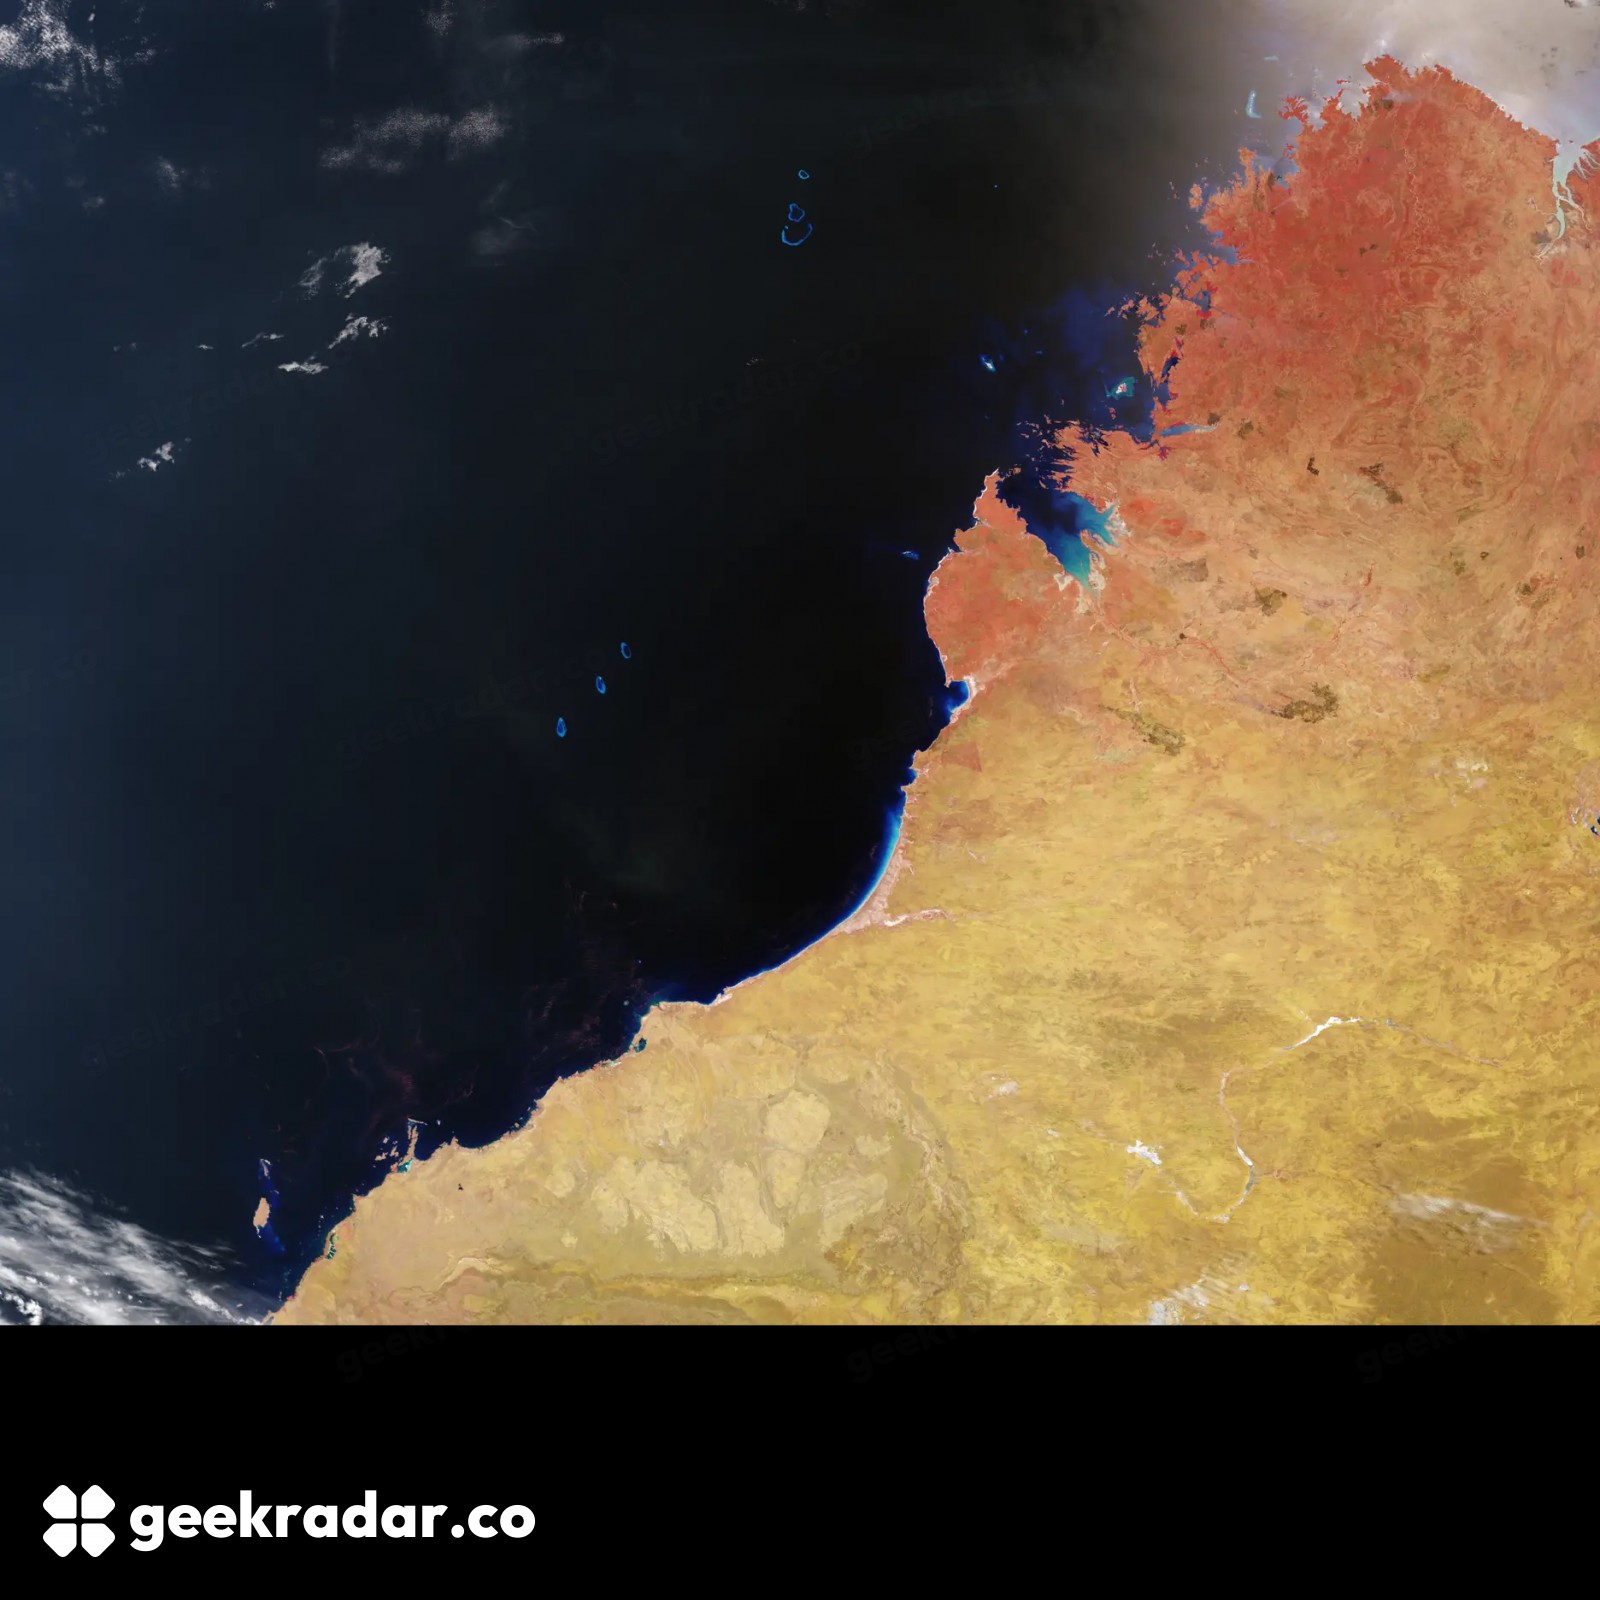
In the companion image published by Copernicus, the peninsula keeps its shape, but the familiar blue water gives way to a nearly black sea. Red now picks out vegetation along the northern coast. Dark brown patches farther inland mark scars from recent fires. Offshore, three coral atolls known as the Rowley Shoals stand out more clearly. The instrument is looking at reflected sunlight in a different combination of bands. A red pixel in this frame answers a different question from a red pixel in the first.
A second pass, over southwestern Europe and North Africa on November 2, makes the point another way. In ESA’s European false-colour composite, dense vegetation appears bright green. Some of those areas line up with cooler ground in the thermal view. Follow the boundary between two features and you can compare them across pictures even when the palettes change, much as Landsat’s view of Chiricahua lets a reader trace the outline of an ancient volcanic structure.
These first observations show that the infrared channels are responding during commissioning. For a reader looking for the mark of a fire, the useful move is to keep Broome in the same place and switch images. The bright land tells you where the satellite saw heat that day. The dark scar can still be there after the ground has cooled.