NASA’s one-metre lidar maps show California’s trees. The year of the flight matters
A decade of airborne surveys covers 78.3% of California’s land area. A hillside in Santa Clara County shows how researchers distinguish treetops, roofs and the ground below.
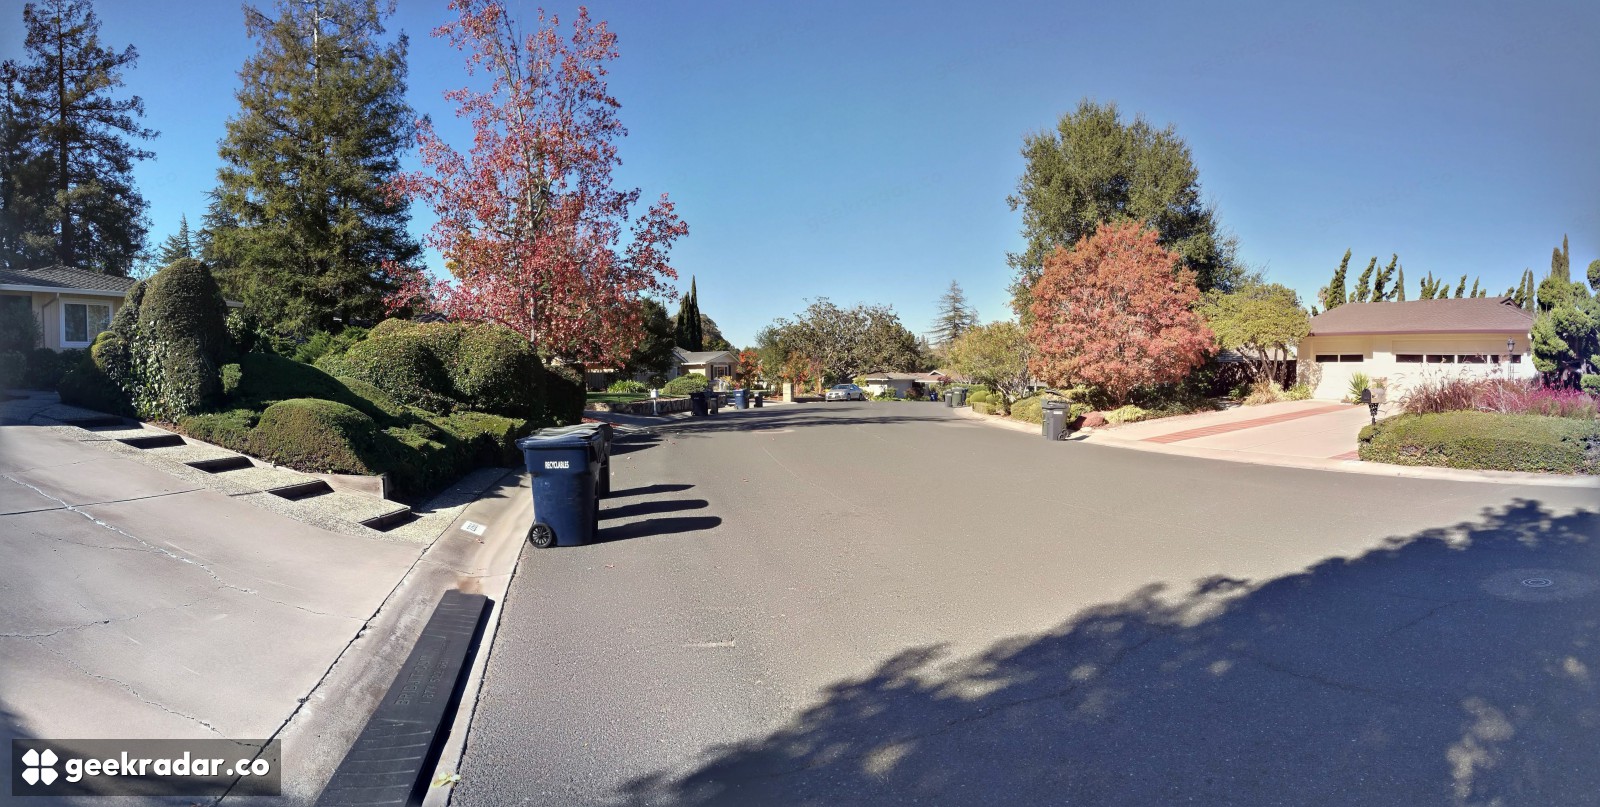
Look at the houses on a California hillside from above and a tree crown can sit at the same height as a roof. For someone mapping woodland near homes, those two surfaces have very different meanings. NASA’s new collection of airborne laser surveys lets researchers separate the ground from what stands on it, on a grid as fine as one metre. It also gives them a way to check how long ago the aircraft flew over that particular tree.
Both details matter to the wildfire research project NASA highlighted on November 18. The agency describes the maps as statewide. The scientific user guide gives the footprint: after overlapping flights are counted only once, the available surveys cover about 331,804 square kilometres, or 78.3% of California’s land area. Researchers can compare places across the state on a common grid. A blank cell outside that footprint says nothing about what grows there.
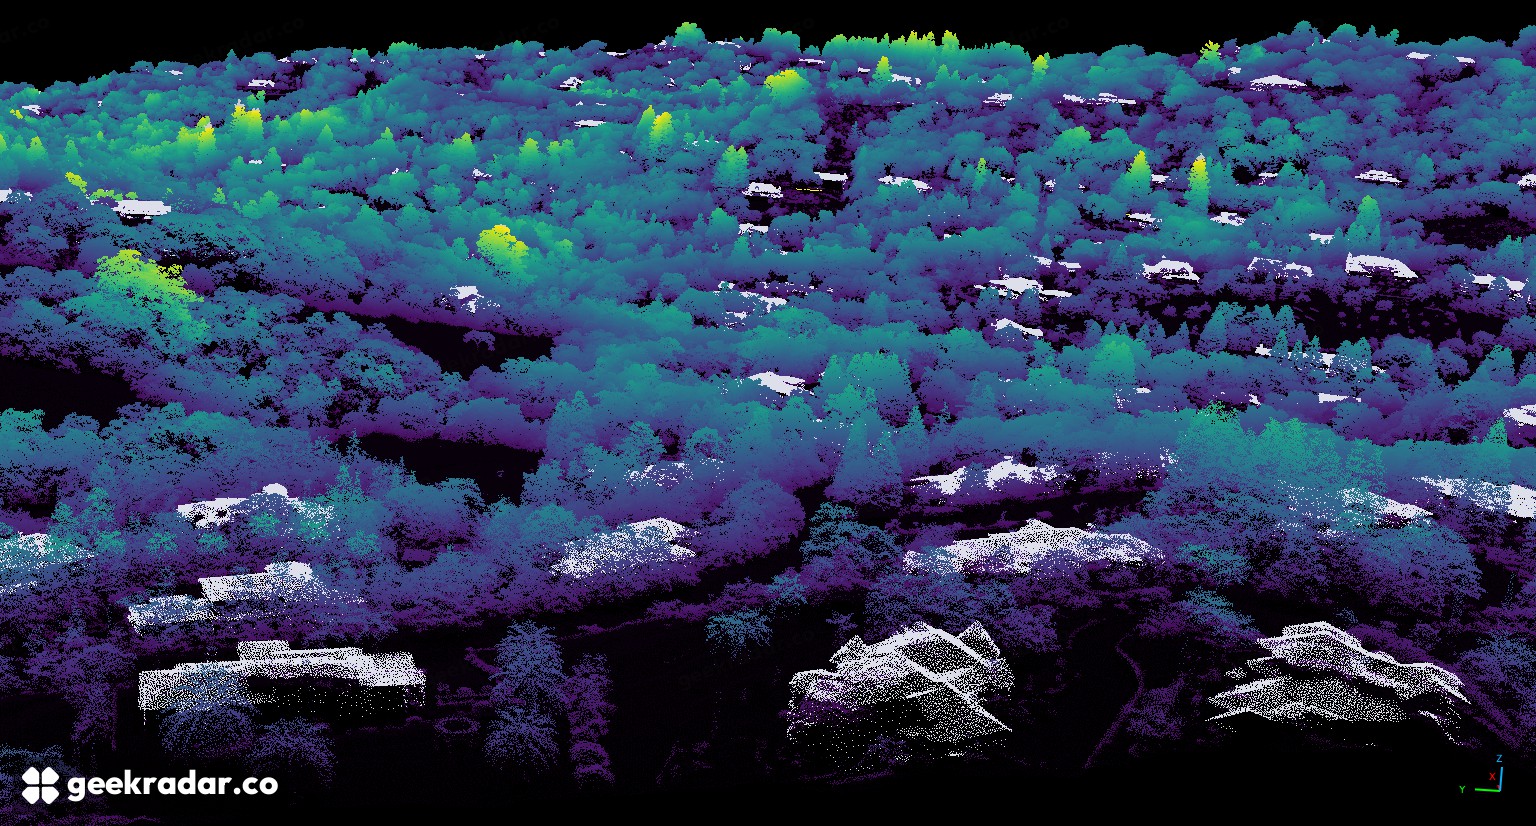
What the aircraft saw in Santa Clara County
The scene NASA published shows houses interspersed with trees in Santa Clara County. The aircraft collected the measurements in 2020. Each dot in the image represents a return from a laser pulse. Some pulses bounced off upper branches or roofs. Others reached the ground through gaps in the vegetation. Together they give an oblique view of a hillside without a camera ever having to take a photograph from that angle.
The team turned those scattered measurements into two aligned surfaces. One estimates the bare ground. The other follows the upper surface of whatever the instrument saw. Subtract the first from the second and a tree on a steep hillside can be measured relative to the soil beneath it. Without that subtraction, an ordinary tree high up the slope could appear taller than a much larger one in the valley.
The same arithmetic gives a building a height. To keep roofs out of vegetation statistics at the coarser 10- and 30-metre scales, the team used outlines of buildings compiled from imagery collected between 2014 and 2018. A roof built after its outline map was made can slip through. In a neighbourhood of mature trees and newer houses, the date of the building map is as relevant as the precision of the laser.
One map assembled from a decade of flights
The data archive published the collection on October 13. It combines roughly 40 terabytes from 118 US Geological Survey campaigns flown between 2013 and 2023. Where flights overlap, the team used the most recent available acquisition. The dataset includes a survey-year layer so readers can check which year actually supplied a measurement. The San Francisco Bay Area entry, for example, lists 2023 for its one-metre product.
For NASA and its California partners, mapping terrain and vegetation gives planners a baseline for studying how landscapes change. Another instrument can answer an entirely different question over similar ground: Sentinel-3C’s thermal observations describe the radiation from the surface. Neither a height nor a surface temperature, on its own, tells a resident what a fire will do today.
Imagine a crew returning to the Santa Clara hillside after several years. A missing stand of trees might mark a genuine change. An empty patch might instead have been empty in the data from the start. Before anyone estimates what has grown back or what needs a closer look, the most useful layer to open is the least spectacular one: the year of the flight.