Landsat caught the Atacama changing flowers in the space of 40 days
September and October views of the same Chilean hills show different flowers taking their turn. Field observations help explain the change that a satellite index alone would miss.
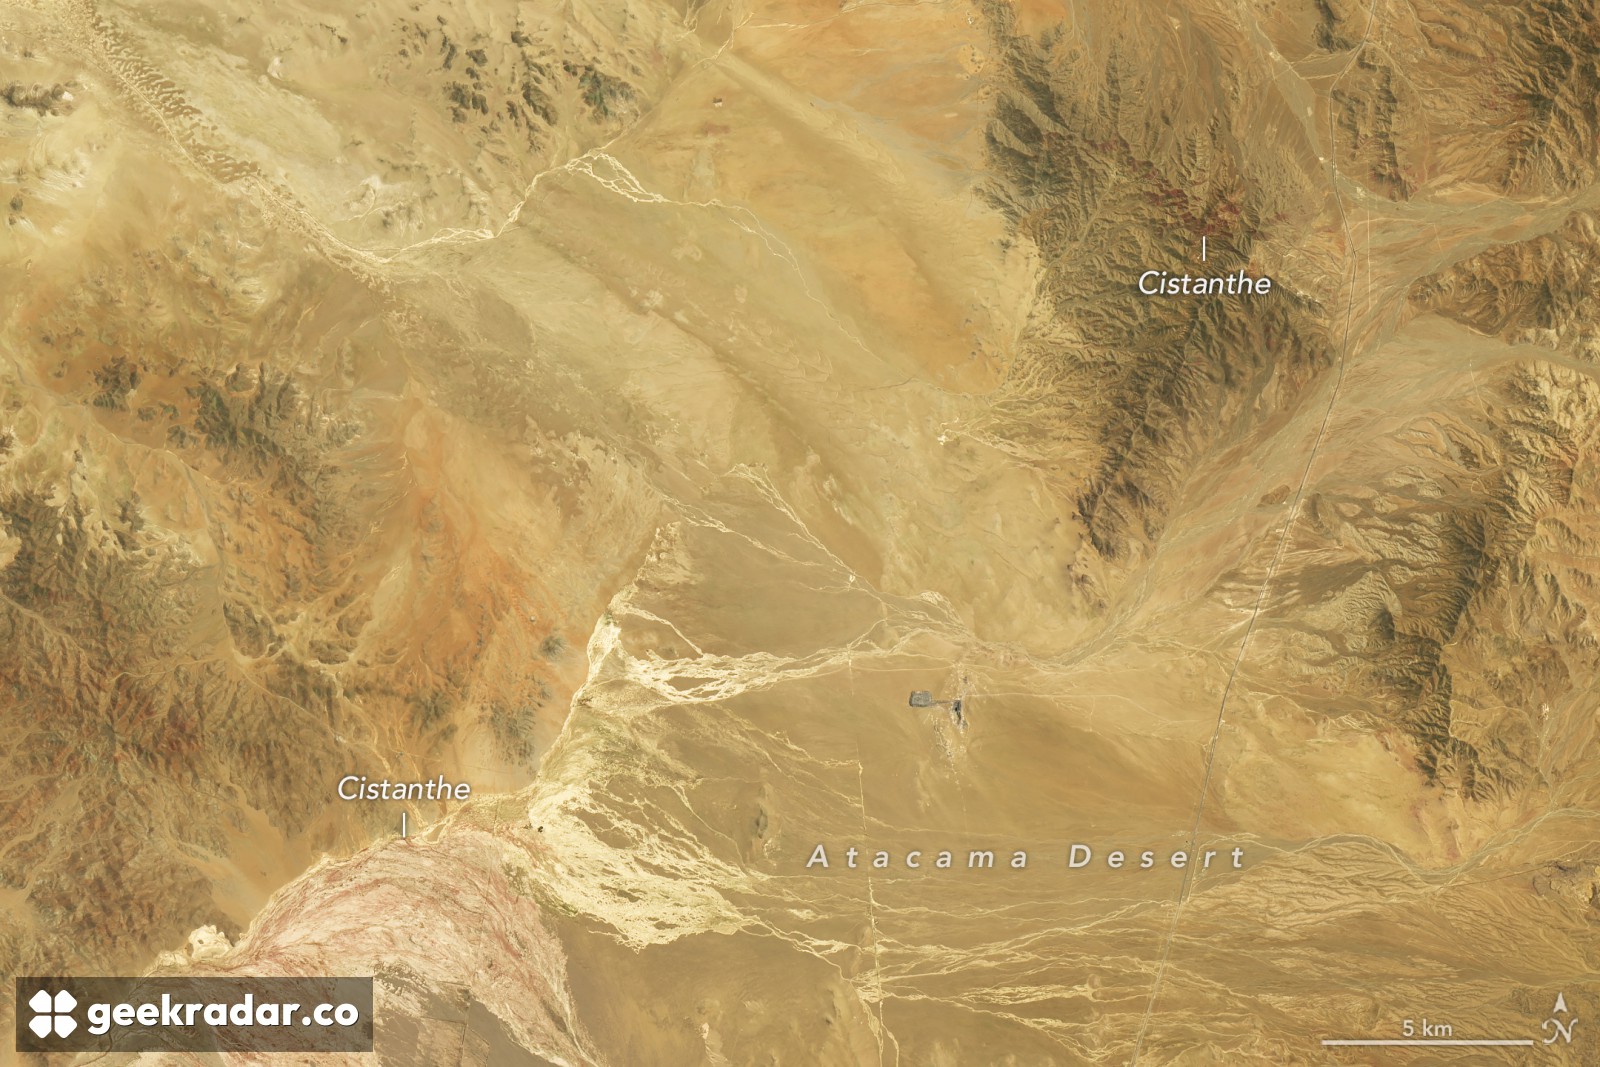
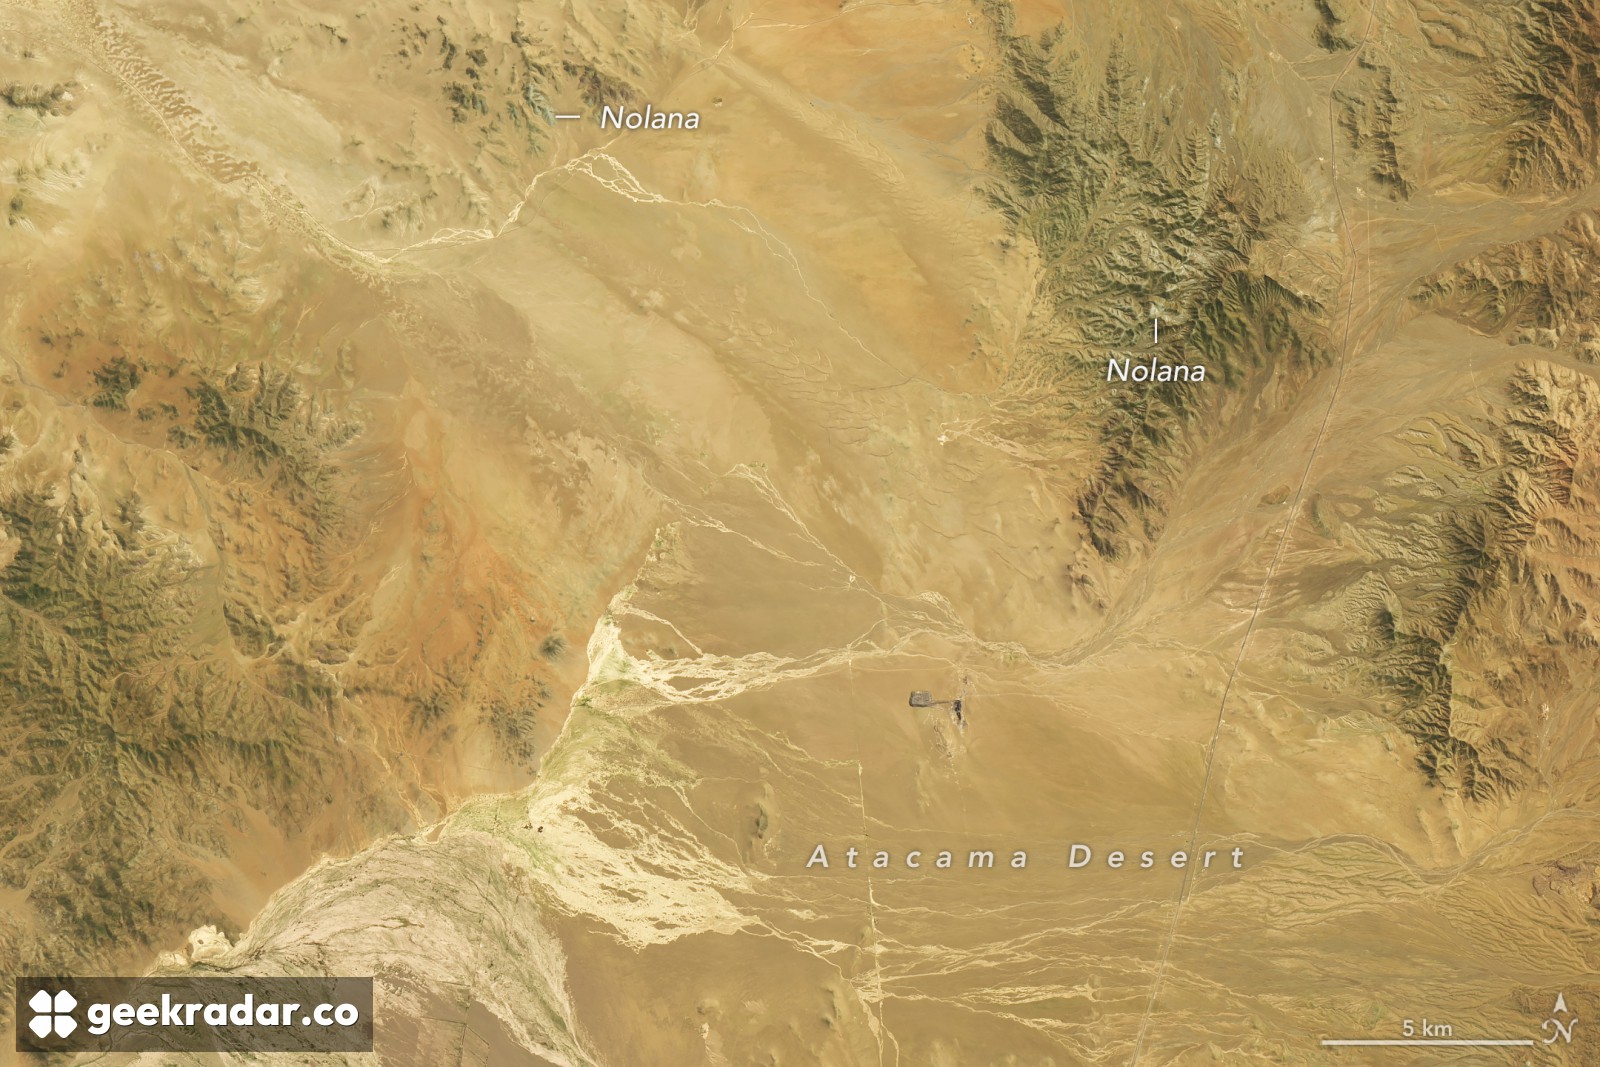
Find the branching pale channels near the bottom of the October satellite image, then look for the same channels in the September view below. The terrain barely changes. The slopes above it do: where white blossoms stood out against green in September, reddish-purple patches appear in October. For anyone hoping to catch Chile’s Atacama Desert in flower, both dates would have been a good choice. They would have seen different plants.
NASA Earth Observatory published the pair on November 19. Landsat 8 passed over the site, about 50 kilometres southwest of Copiapó in northern Chile, on September 14. Landsat 9 returned the October 24 view. Researchers at the Pontificia Universidad Católica de Valparaíso identified the earlier pale patches as Nolana, probably Nolana baccata, known locally as suspiro. They photographed white-flowering hillsides on September 24. By late October, Cistanthe, known as pata de guanaco, was prominent.
Rain had set the sequence in motion months earlier. Winter fronts brought water far enough north for dormant seeds to germinate as El Niño strengthened in the Pacific. The lag matters if you are trying to interpret a photograph: the weather that makes a hillside look like this can have passed long before the flowers open. EFE’s November 1 reporting from Chile documented the bloom on the ground, including at Llanos de Challe, farther south.
How do you measure a desert in flower?
A purple hillside makes a persuasive photograph, but how would you compare it with a flowering season before anyone thought to stand in the same spot with a camera? In a study published in 2019, Roberto Chávez and colleagues reconstructed vegetation cycles for the Atacama between 1981 and 2015. They identified 13 flowering-desert events. Three stood out under their measures of intensity, duration and area: 1997–98, 2002–03 and 2011.
Their starting point was a time series of the normalized difference vegetation index, or NDVI. The calculation compares reflected red and near-infrared light. The US Geological Survey explains how the index measures greenness. Repeated measurements can show where vegetation appeared, how long the signal endured and how unusual it was for a given location. They cannot tell you that a particular patch was covered in white flowers. That distinction is also why the scale used in a satellite image changes what you can read from it.
Plant geographer Andrés Moreira-Muñoz told NASA that this season may be the most significant since satellite monitoring began. That assessment covers the bloom’s reach and staying power as well as its intensity. Two frames of one hillside illustrate a narrower finding with unusual clarity. A map could mark the slope as flowering on both dates, get both entries right, and leave out the most interesting thing that happened there in between.