Steam Deck’s new performance charts need more than a glance at the average
Valve adds player-sourced performance distributions, with useful filters and important limits on comparisons.
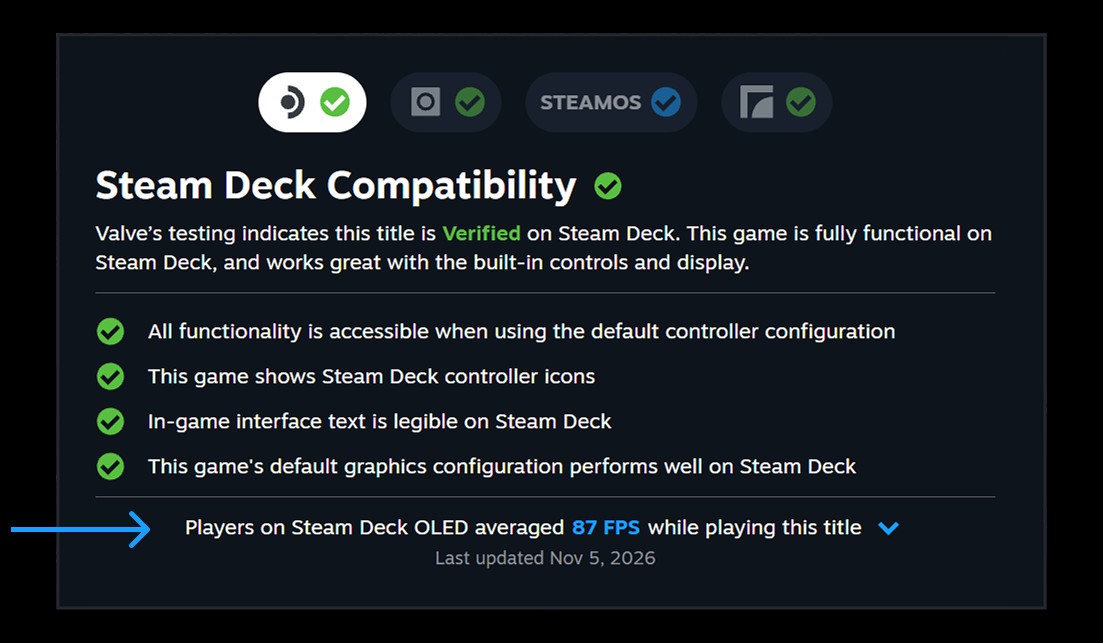
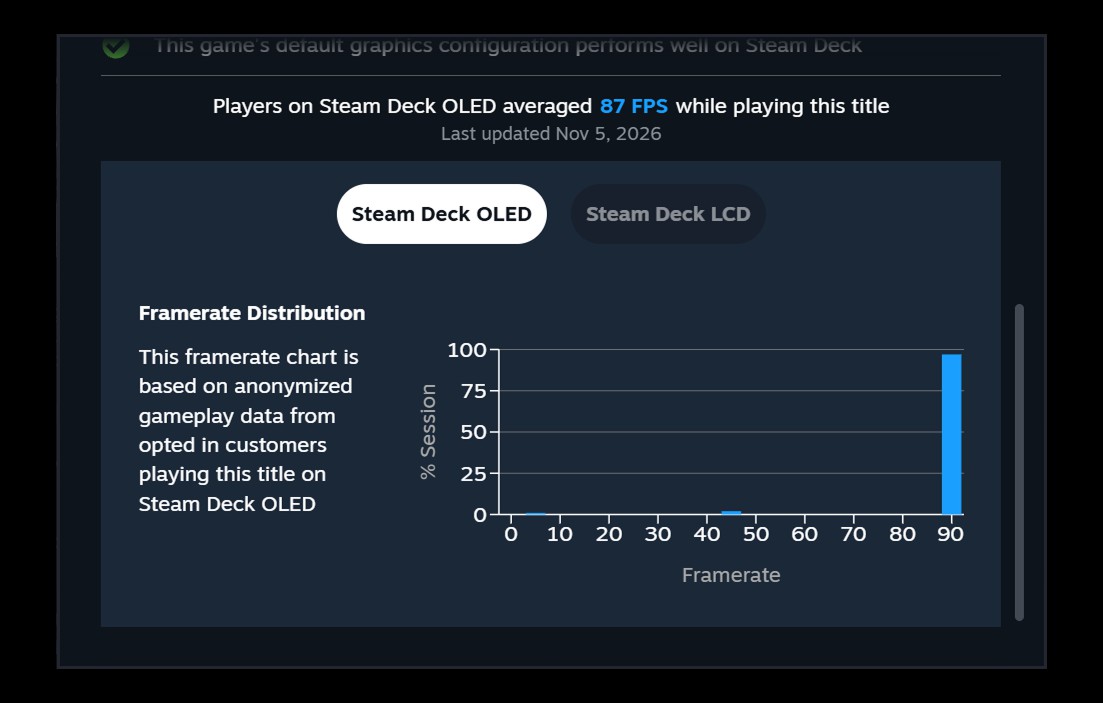
Steam Deck OLED buyers can now see how a game has actually performed on other players' handhelds before relying on its compatibility badge. Valve's new framerate feature adds an average and a distribution of recorded frame rates to supported store pages. The more interesting part is the distribution: it can reveal how much of the collected playtime sits below the headline number.
The feature covers thousands of games with enough anonymous, opted-in samples. Verified, Playable and Unsupported titles can qualify. That matters because compatibility and performance answer different questions. A game can launch and accept controller input while still missing the frame-rate target a particular player considers comfortable.
Read the histogram before the average
The store information appears under Steam Deck Compatibility, through Learn More. Valve also puts it in the library for Steam Client Beta users. LCD and OLED data are separated, and the controls can filter out sessions using a frame limiter below the device's default ceiling: 60fps for LCD and 90fps for OLED.
A histogram groups samples into ranges. If an average looks encouraging but a substantial portion of observations sits much lower, the distribution gives that average a necessary second dimension. It is a better starting point for a buying decision than assuming every minute resembles the mean.
However, these are observations from real configurations, not a standardized laboratory test. Valve does not normalize custom in-game settings. Two owners can contribute very different workloads because they chose different resolutions, graphics options or power settings. The data can show what people are experiencing without promising what your preferred configuration will achieve.
Why 90 and 45 can coexist with a 75fps average
Valve's explanation includes a useful trap for readers of performance charts. With synchronization on a 90Hz display, frames can be presented at intervals corresponding to 90fps or 45fps. A repeating pattern of two faster intervals and one slower interval can produce an average of 75fps.
Likewise, a 60fps limit on a 90Hz display can leave observations in more than one histogram bucket. The chart is not necessarily contradicting the limiter, and a visible 90fps bucket does not prove the whole game normally runs at 90fps. Refresh timing and frame presentation shape the distribution.
This is why the hardware distinction matters beyond an OLED label. Our Switch 2 and Steam Deck OLED comparison explains the library and compatibility decision; the new chart adds evidence about the performance side without settling every purchase question.
Participation is optional
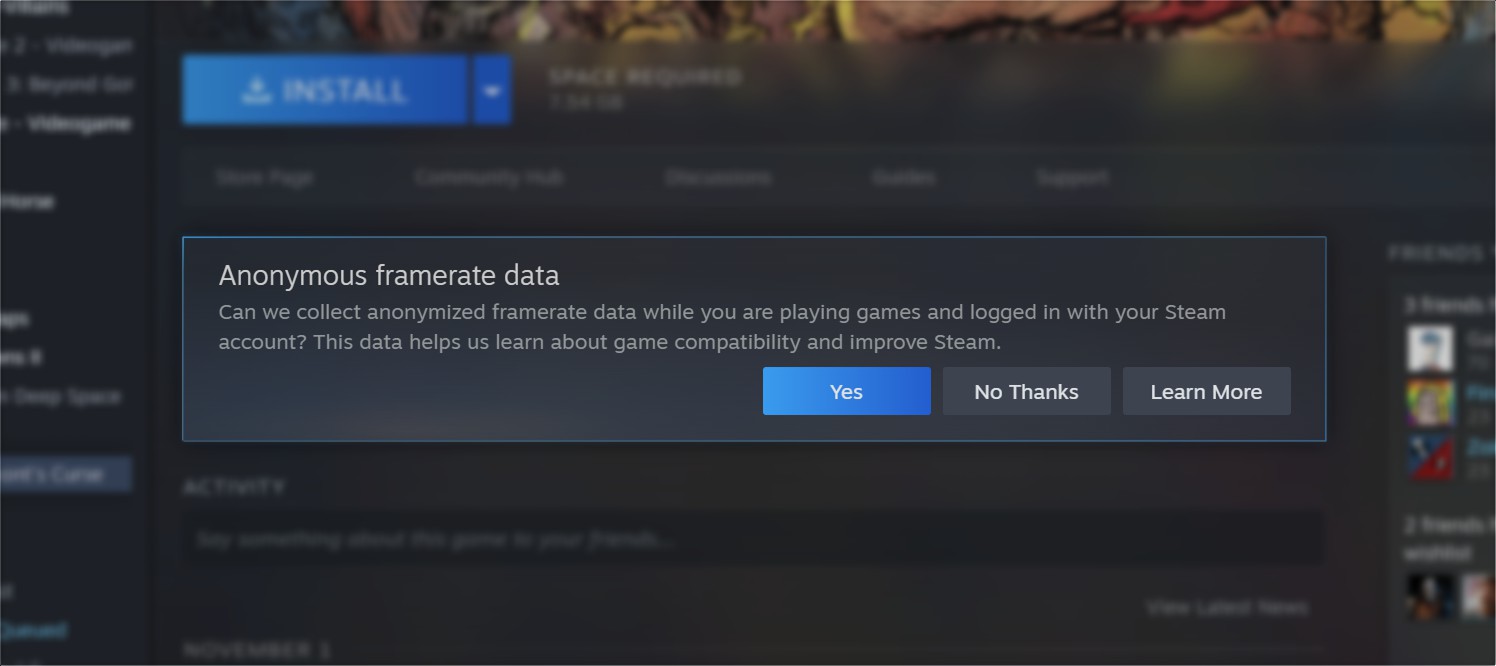
Contributing requires opting into Anonymous Game Framerate Data under account data and browsing settings. Valve says data are anonymous and only publishes game results after a minimum sample threshold. It has not supplied a universal number that readers should assume for that threshold.
Desktop collection is being introduced through the client beta as groundwork for broader device information. That is not the same as an already available performance prediction for every PC combination.
The result is a welcome change in what Steam can tell a handheld buyer. A compatibility badge describes whether a game fits the machine's controls and software environment; observed frame-rate data help explain the compromises inside that fit. Read both, then ask whether the configurations behind the graph resemble the way you intend to play.