Antarctic sea-ice loss is leaving a saltier signature beneath the surface
A study links reduced seasonal meltwater with changes in Antarctic Intermediate Water. Surface ice maps and subsurface measurements tell different parts of the story.
The loss of Antarctic sea ice is changing more than the white area visible on a satellite map. A new study links the shift after 2015 to saltier, denser Antarctic Intermediate Water, a water mass that carries Southern Ocean conditions into the wider ocean. The mechanism is less intuitive than simply saying that melting ice adds fresh water: less seasonal sea ice can also mean less meltwater arriving later.
The Nature Climate Change study combines Argo-derived ocean observations with satellite and reanalysis data. Its abstract describes a reversal from an earlier freshening tendency to increasing salinity in this intermediate water. The result concerns a particular part of ocean circulation, not a claim that every ocean basin changed in the same way on the same date.
Why less ice can lead to saltier water
Sea ice forms and melts seasonally. During earlier decades of expansion, the study says, summertime meltwater helped freshen the upper polar ocean and the water feeding Antarctic Intermediate Water. After 2015, repeated losses reduced that contribution. The researchers connect the changed freshwater supply with increasing salinity and density.
This is different from discussing land ice flowing into the sea. Ice shelves, glaciers and seasonal sea ice interact with the ocean in different ways; grouping them into one generic “melting ice” process can conceal the mechanism being studied. The timing and location of freshwater delivery matter, not just its existence somewhere around Antarctica.
Density matters because ocean water is not one uniformly mixed reservoir. Changes in temperature and salt content influence how layers sit and exchange water. The study interprets the observed salinification as a sign of a broader reorganization of that structure. It does not supply a date for a specific local weather consequence.
A satellite map provides context, not the salinity measurement
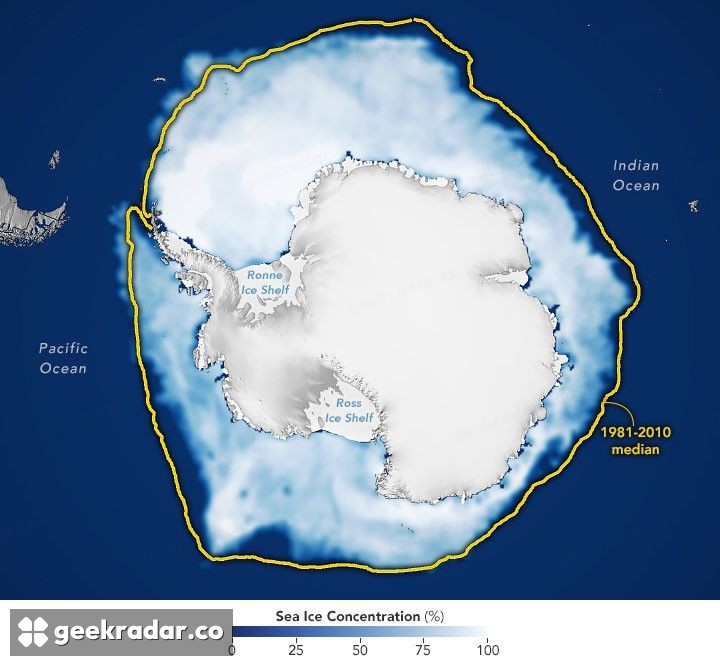
NASA’s 2026 sea-ice maximum assessment puts the September 14 extent at about 17.59 million square kilometres, the third-lowest maximum in the satellite record. That is useful contemporary context, but it measures surface ice extent. It is not the instrument that directly establishes the intermediate water’s salinity.
The distinction also prevents one unusually low year from carrying the whole argument. The research uses a sequence of observations and multiple datasets; the ice map illustrates one point in the recent record. Independent coverage has emphasized that the available observational period remains limited compared with long ocean cycles, leaving uncertainty about persistence and future evolution.
The finding is consequential because it connects a visible surface change with less visible water below. It deserves attention without being turned into an unsupported countdown to a circulation collapse. The next question is how consistently the changed freshwater supply continues to reshape the water mass as more observations accumulate. A smaller seasonal ice cover can leave a signature long after the surface has become open water.