New Guinea’s smoke is visible from space. Counting its carbon takes more than a picture
NASA’s new report combines an October 11 satellite view with dated emissions estimates. The dates, geography and units explain what the evidence can show.
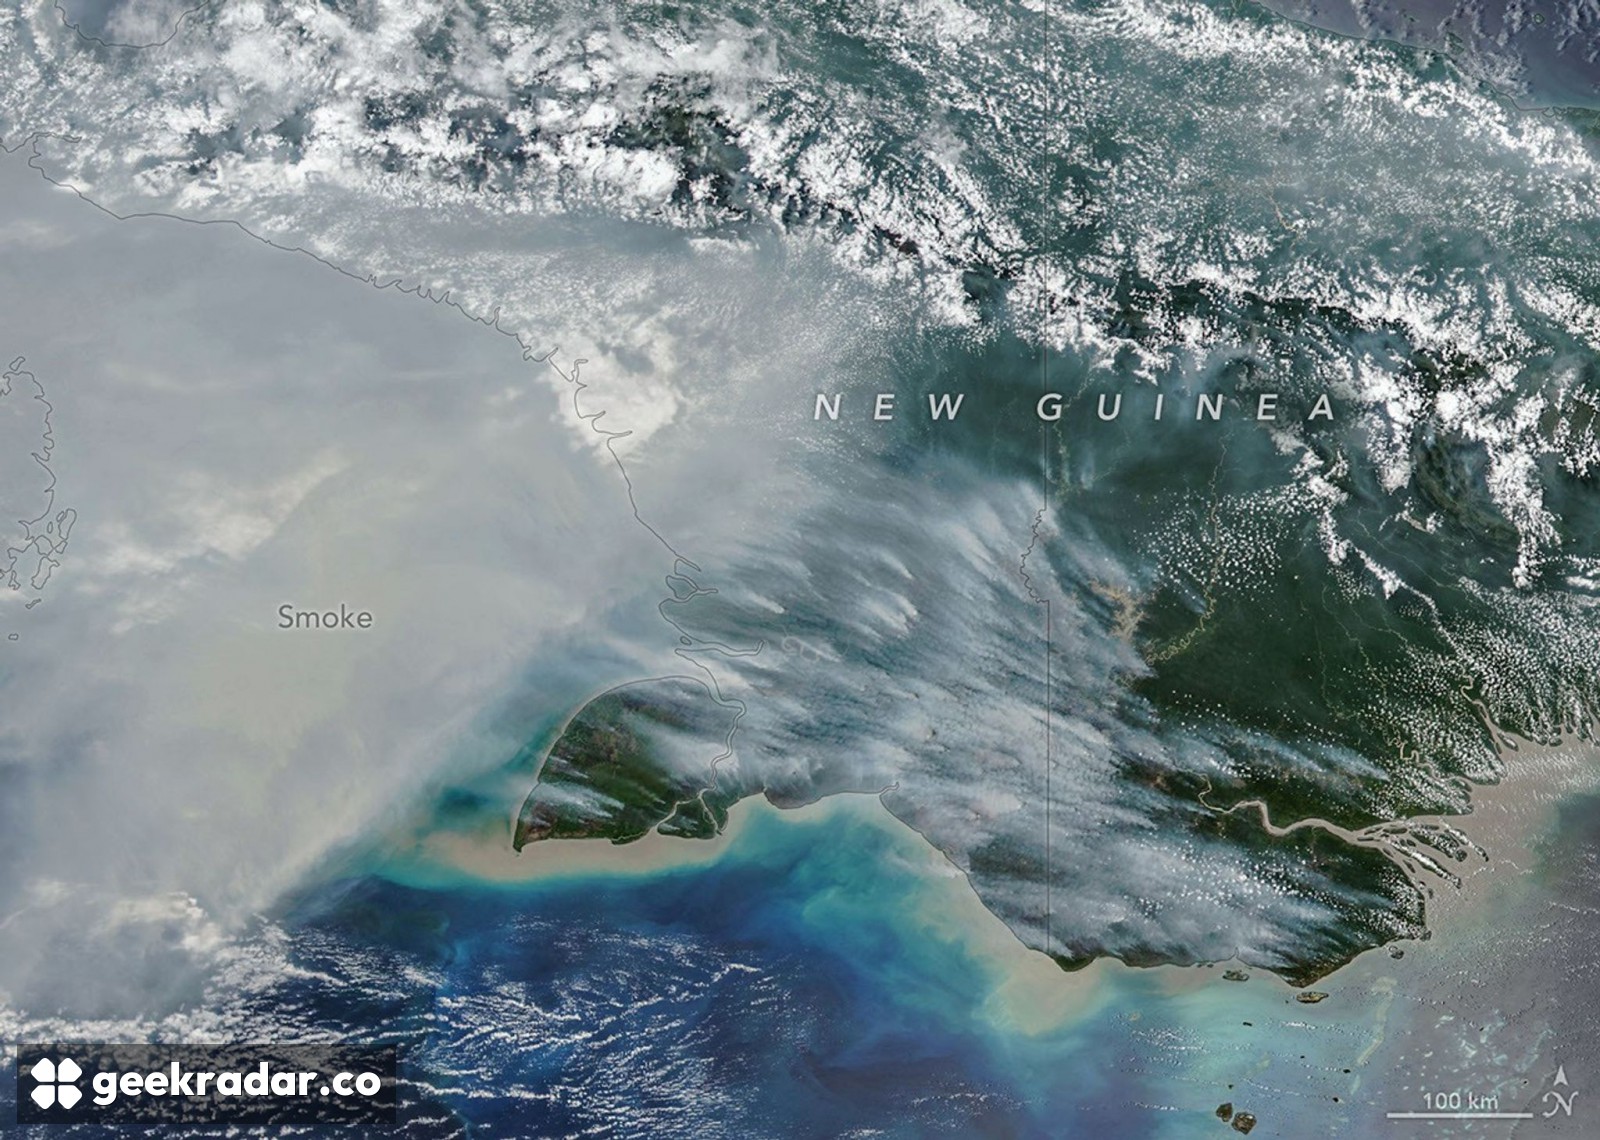
The smoke spreading across southern New Guinea in NASA's latest Earth Observatory report is visible evidence of an exceptional fire season. The emissions numbers require another layer of evidence: satellite observations combined with a model of what is burning. A striking image and an estimate of carbon released are related, but they are not interchangeable measurements.
NASA's October 22 report uses an October 11 image from the VIIRS instrument aboard NOAA-20. It shows smoke across the southern part of the island, which is divided between Indonesia in the west and Papua New Guinea in the east. The image's acquisition date matters: it is not a live view of conditions on the day the report appeared.
Image: NASA Earth Observatory / Michala Garrison, using NOAA-20/VIIRS data.
What the smoke shows
The broad pale plume makes the event legible at a scale a ground photograph could not easily capture. Coastlines and mountain ranges provide geographic context, while the distinction between smoke and brighter clouds helps explain why the scene is more than a uniformly hazy landscape. The original annotated view can be enlarged to examine those relationships.
It cannot, on its own, tell a reader how much vegetation has burned or how much carbon has entered the atmosphere. Smoke can move away from its source, and a single overpass is a moment in a changing event. An image also cannot establish the cause of every ignition. NASA connects the wider episode to drought associated with El Niño and human-set fires, without making the photograph proof of each individual cause.
This is an important distinction in remote sensing: the sensor supplies observations, while the question determines what additional information is needed. Locating a smoke plume and estimating emissions are different analytical tasks, even when both begin with satellites.
The figures are carbon, not carbon dioxide, and they are dated estimates rather than final totals for 2026. The two areas are also distinct reporting regions. Treating the country of Papua New Guinea as the entire island would put the wrong geography around the numbers.
How observations become an emissions estimate
A new paper describing the database's near-real-time extension explains the method. GFED5NRT uses VIIRS detections of active fires with tables specific to regions and vegetation types. Those tables connect fire observations with estimates of affected area and fuel consumption, maintaining continuity with the longer GFED record.
That additional information is necessary because a detection is not a standard parcel of fuel. Different vegetation and burning conditions can produce different emissions. A count of visible fire activity must be interpreted through those differences before it becomes a mass estimate.
The GFED team’s methodological guidance warns that uncertainties can be substantial and generally increase at smaller spatial scales. A regional estimate should not be read as an equally precise account of every small area inside it. The scale of the question needs to match the scale the method can support.
Speed and continuity both matter
The extension also addresses a less photogenic problem: keeping a long scientific record useful as older observing instruments age. A current map is valuable for following an event. A comparable historical series is what lets researchers determine how unusual it is. Changing sensors without accounting for their differences could confuse a change in observation with a change on Earth.
For readers far from New Guinea, including in Italy, that is the broader relevance of this Earth-observation work. The smoke makes the event visible. The careful connection between instruments, models, dates and units is what allows the image to become evidence about its scale.