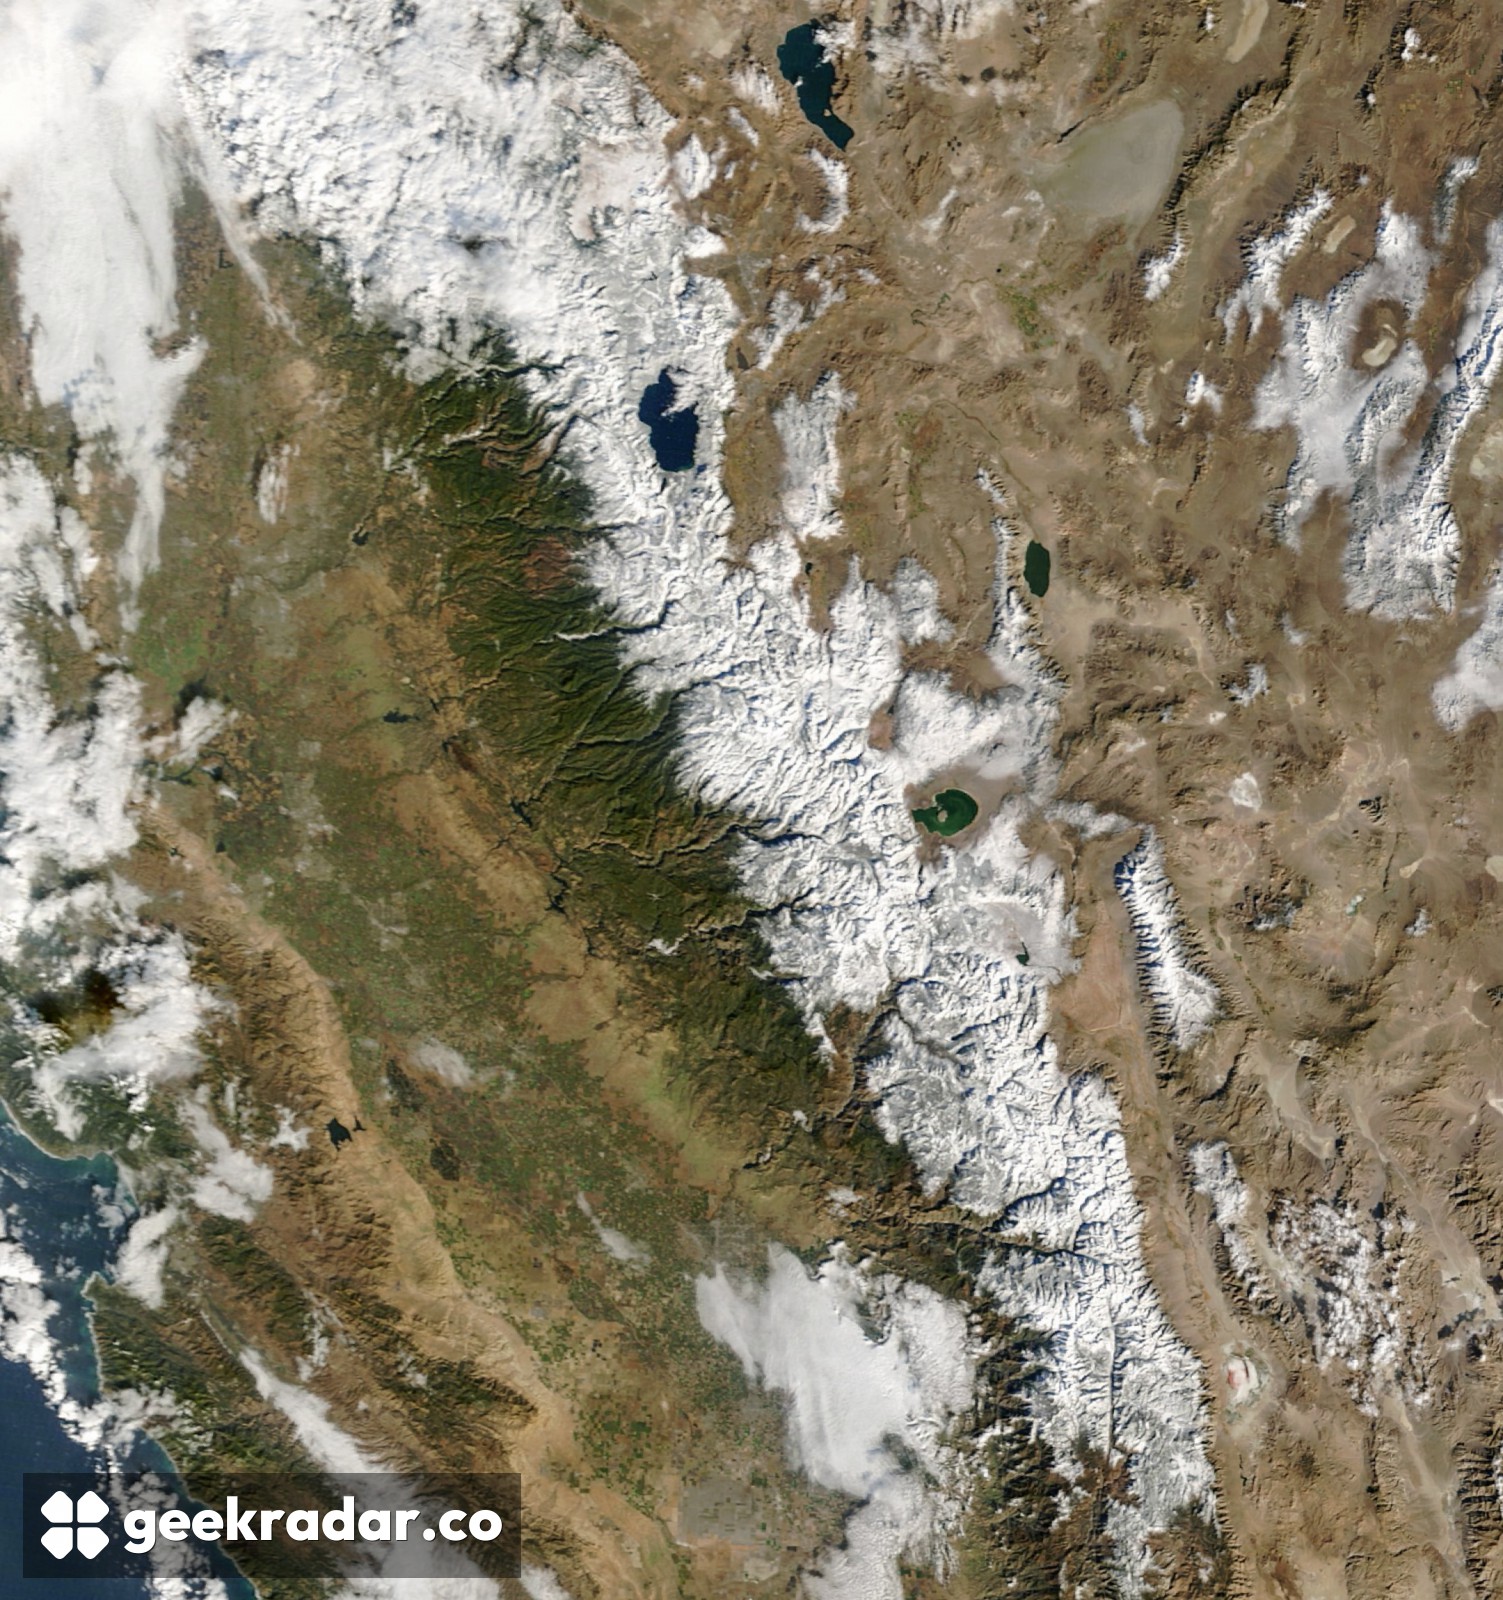
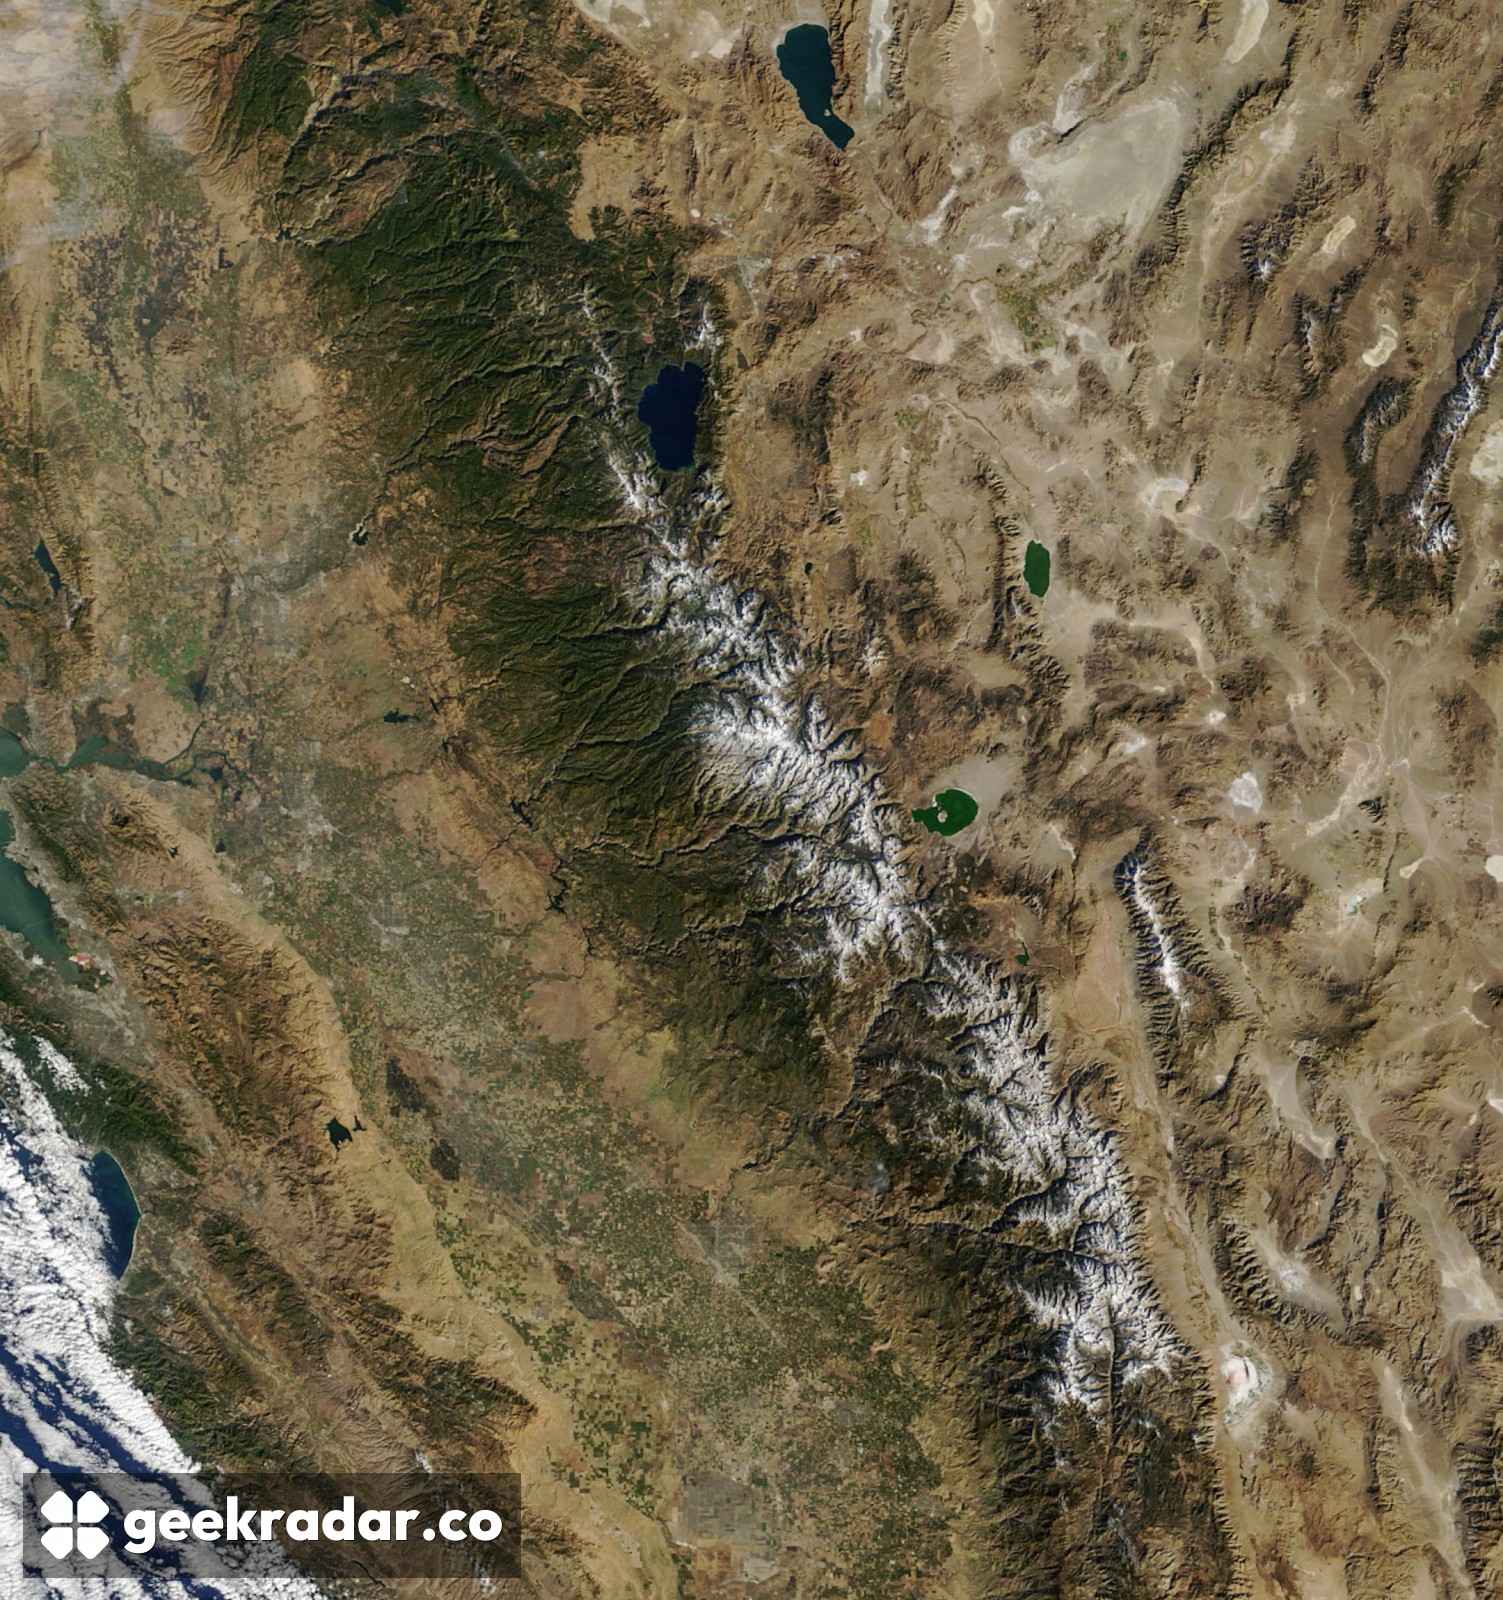
Two days turned the Sierra Nevada white. How much water is in that snow?
NASA’s Terra satellite caught the ridges around Lake Tahoe before and after a storm. A pressure sensor underneath the snow answers a question those two images leave open.
On November 12, the dark shape of Lake Tahoe sat beside a mainly brown Sierra Nevada. Two mornings later, the lake was still easy to pick out, but white ridges now ran far down the range. NASA’s Terra satellite caught a break between storms. Its two views of the same mountains answer one question particularly well. They show how far the snow spread. To work out how much water the mountains are holding, hydrologists also need to know the mass of snow on the ground.
Nearly 30 centimetres of fresh snow fell at Donner Pass on November 13, according to the Central Sierra Snow Laboratory, as reported by NASA. That number describes the depth added at one pass northwest of the lake. A day later, Terra's Moderate Resolution Imaging Spectroradiometer, or MODIS, could see snow across a much larger area. Neither observation supplies the missing dimension of the other. There is no reason to assign Donner Pass’s 30 centimetres to every white pixel.
What a snow pillow measures
Picture two patches on opposite slopes, each a square metre in area and covered by snow to the same depth. One patch is freshly fallen and airy. The other holds denser snow. Both can look white from orbit, yet the denser patch holds more water. A snow pillow laid on the ground senses the pressure of the snow above it. With the area of the pillow known, that load gives the water equivalent, even while all the water is still frozen.
The US Natural Resources Conservation Service describes a hands-on counterpart to that sensor. A surveyor pushes a hollow tube through the snow and checks its base for soil to establish that it reached the ground. The surveyor clears the soil, weighs the tube and its snow core, then subtracts the empty tube’s weight. Leaving the bottom few centimetres of snow behind would mean weighing only part of the column. A small trace of dirt is a surprisingly useful check on a water measurement.
Two percentages for the same snow
Even a good measurement can look contradictory without its reference date. In a February 2024 California water-supply report, the central Sierra stations averaged 13.6 inches of water equivalent on February 8. The table gives that single reading as 75% of normal for the date and 51% of the April 1 average. The first compares February with February. The second asks how much had accumulated against a later spring benchmark. Both percentages describe exactly the same snow on exactly the same morning.
As with the Landsat images of a changing Atacama bloom, the strength of Terra’s pair is that the landscape stays in place while its surface changes. Follow the ridges south from Lake Tahoe and the November storm practically draws its own map. To put litres against that white area, the next useful observation comes from underneath it.